What is the S&P 500?


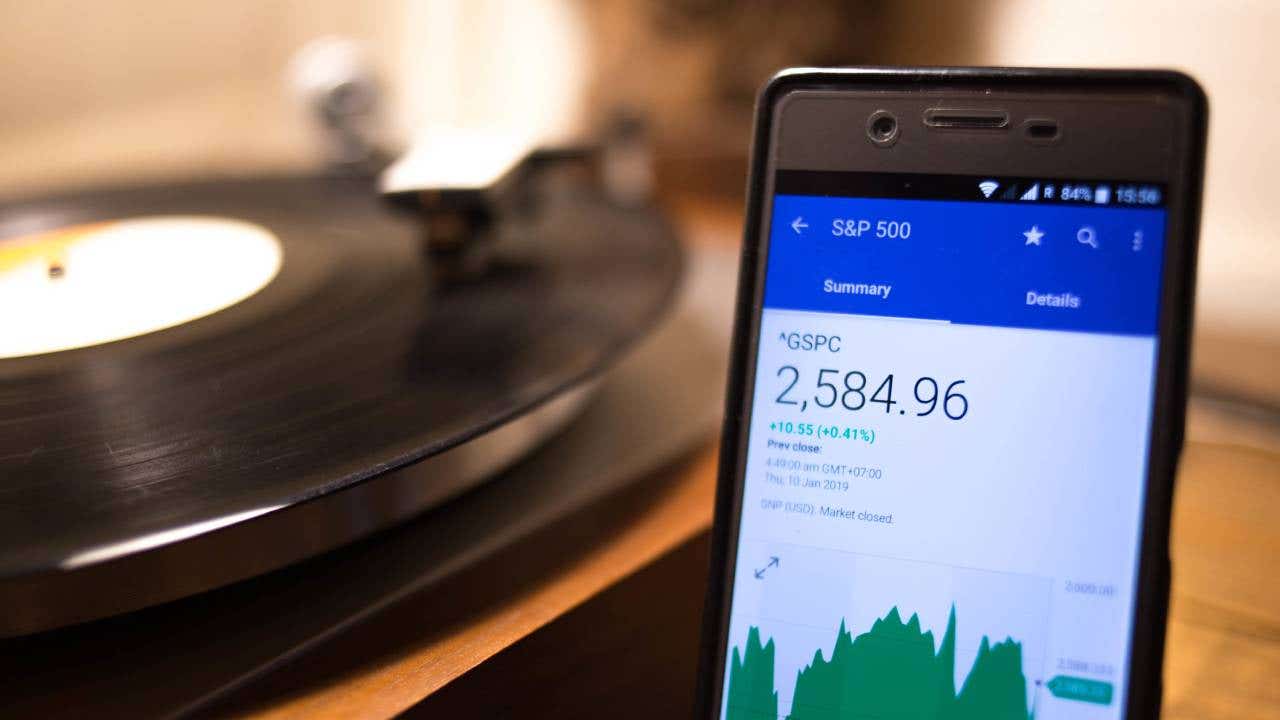
The Standard & Poor’s 500 index, or S&P 500, is perhaps the world’s most well-known stock index. The index contains about 500 of the largest publicly traded companies in the U.S., making it a bellwether for stocks. It includes stocks across all 11 sectors of the economy, as defined by the GICS classification system.
Here are the details on the S&P 500, including its top holdings and long-term performance.
Why the S&P is shorthand for ‘the market’
When people ask “how the market did today,” they’re often referring specifically to the S&P 500.
According to Standard & Poor’s, the index represents about 80 percent of the total value of all stocks trading in the U.S. markets, which is why the index is synonymous with the market itself.
Tens of trillions of dollars are invested in the companies in the index with investors purchasing shares of individual companies directly or via a fund that tracks the entire index.
Investing in an index fund buys you immediate diversified exposure to the hundreds of companies contained in the index.
For companies, being added to the index is not only prestigious, it’s also financially valuable.
When a new firm is added to the S&P 500, all the funds tracking the index must adjust by purchasing shares of the new stock and selling the old one that’s being replaced. And when net new money is added to an S&P 500 index fund, the fund company must buy the stocks in it.
All that buying helps keep the stocks in the S&P 500 running high. A strong stock price makes it cheaper for a company to raise money by issuing new shares and generally makes the firm more attractive.
How does a stock get added to the S&P 500?
Standard & Poor’s has strict criteria for being admitted into its flagship index, and companies are admitted on a quarterly basis, if they fulfill the criteria (and may also be replaced and removed).
For example, so far in 2025, S&P Dow Jones Indices, which manages the S&P 500 index, has added DoorDash (DASH), TKO Group Holdings (TKO), Williams-Sonoma (WSM) and Expand Energy (EXE) to the index.
These companies replaced BorgWarner (BWA), Teleflex (TFX), Celanese (CE) and FMC (FMC).
Here are the key requirements to make it into the index, as of March 2025:
- Must be a U.S.-based company.
- Must have a market capitalization of at least $20.5 billion.
- Must be traded on a major U.S. exchange, such as the New York Stock Exchange (NYSE) or Nasdaq.
- Companies must have positive earnings in the latest quarter and over the prior four quarters summed together.
- Must have traded at least 250,000 daily shares in the six months prior to index inclusion.
Standard & Poor’s also considers how the inclusion of a stock maintains a balance of sectors for the index as a whole. Index managers want a collection of companies that gives a representative picture of major American businesses.
The S&P 500 is a weighted index
The S&P 500 is an index that’s weighted according to the size of the companies in the index. The larger the company, the more heft it carries. The weightings rely on each firm’s market capitalization — the total value of its outstanding shares. A larger firm carries a larger weighting in the index, though Standard & Poor’s makes some adjustments based on how much of the stock is actually traded (“floated”) in the market (versus how much is held off the market.)
The price of the S&P 500 index that you see quoted — for example, 4,697.23 — is measured in points, not dollars. That’s the weighted average value of all the index’s components. As the component stocks move up or down, the index rises or falls according to the calculation.
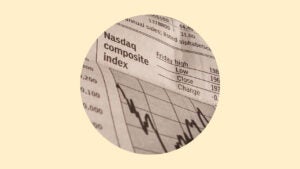
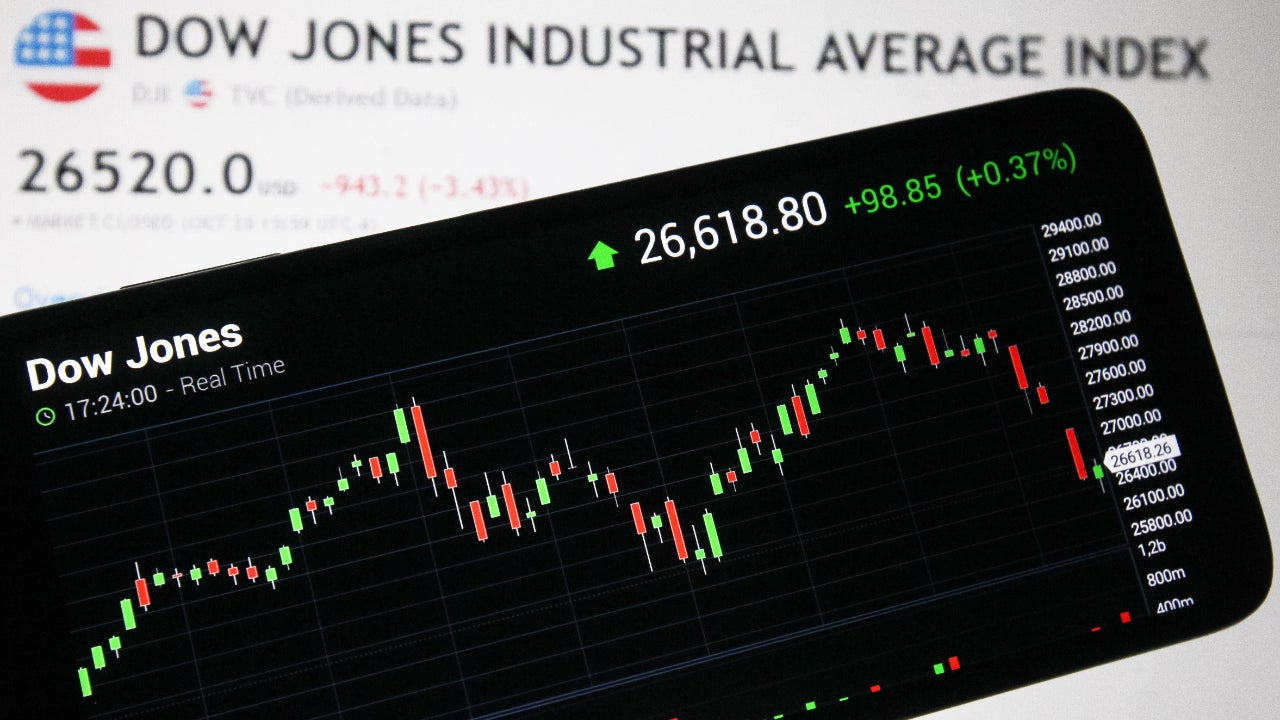
Other popular indexes include the Dow Jones Industrial Average, which tracks 30 stocks across major sectors, and the Nasdaq Composite, which follows more than 3,000 companies on the Nasdaq exchange.
What are the largest companies in the S&P 500?
The market’s largest companies are represented heavily in the index, and you’ll recognize some household names, including some of the popular Magnificent 7 stocks. Alphabet (parent of Google) has multiple classes of stock, so it appears in the list more than once.
The stocks are ranked by what percentage of the index they comprise (as of April 8, 2025, according to data from Slickcharts), and this weighting changes over time as companies grow or shrink.
- Apple: 6.35 percent
- Microsoft: 6.20 percent
- NVIDIA Corp.: 5.57 percent
- Amazon.com: 3.85 percent
- Meta Platforms Class A: 2.63 percent
- Berkshire Hathaway Class B: 2.09 percent
- Alphabet Class A: 1.99 percent
- Broadcom: 1.68 precent
- Alphabet Class C: 1.64 percent
- Tesla Inc.: 1.52 percent
It’s worth noting that these 10 stocks alone make up about 33 percent of the total value of the index. The other 490 or so stocks represent the remaining 67 percent of the index’s value. So, the S&P 500 is heavily weighted to its largest components, and the largest stocks have market caps in the trillions, literally more than 100 times the minimum to be admitted into the index.
The S&P 500 has been a great investment over the years
The S&P 500 is the most followed stock index in the world and one of the most successful as well. Over time, the index has returned about 10 percent annually on average for those who remain invested over longer periods of time. But that doesn’t mean you earn 10 percent on your investments every single year.
The S&P can be extremely volatile over short timeframes. From the S&P’s peak in February 2025 to the end of the trading day after U.S. President Donald Trump rolled out his “Liberation Day” tariff plans, the index was down more than 17 percent. Even with that gut-wrenching drop, longer-term investors still came out ahead.
Here’s the S&P 500’s performance over the last 10 years, to April 8, 2025, and its average annual performance and total performance over four time periods.
| Time | 1 year | 3 years | 5 years | 10 years |
|---|---|---|---|---|
| Annualized return | -4.2 percent | 6.6 percent | 12.6 percent | 9.1 percent |
| Total return | -4.2 percent | 21.2 percent | 81.2 percent | 139.4 percent |
This kind of consistently strong performance as well as broad diversification are reasons legendary investor Warren Buffett recommends that individual investors buy an S&P 500 index fund, hold on through thick and thin, and ideally add more money to their position over time.
It’s remarkably easy to buy an S&P 500 index fund, and the best index funds offer a low-cost way to own the whole index, often charging just a few dollars for every $10,000 invested.
Bottom line
The S&P 500 index tracks hundreds of the largest and most successful American companies, giving investors a way to measure the performance of American business. It’s also a solid basis for funds, allowing investors to capture the index’s attractive returns in a low-cost vehicle.
— Bankrate’s Dayana Yochim contributed to an update.
Editorial Disclaimer: All investors are advised to conduct their own independent research into investment strategies before making an investment decision. In addition, investors are advised that past investment product performance is no guarantee of future price appreciation.
Why we ask for feedback Your feedback helps us improve our content and services. It takes less than a minute to complete.
Your responses are anonymous and will only be used for improving our website.