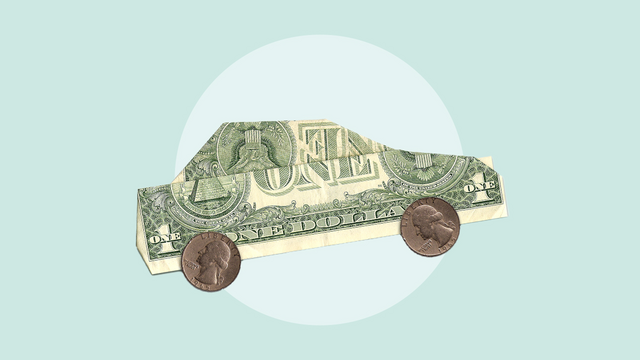
Study: Americans pay $575 per month in hidden car ownership costs


If it feels like your car is eating more of your paycheck than ever, you’re not imagining it — car ownership costs are rising faster than inflation. Bankrate’s latest Hidden Cost of Car Ownership Study reveals that the average driver now spends $6,894 in hidden expenses per year on their car. This marks a 3.1 percent increase over last year, adding more tension to already strained household budgets.
Bankrate’s Tariffs and Inflation Consumer Sentiment survey found that roughly two-thirds of Americans (65 percent) expect President Trump’s import tariffs to worsen their personal finances. With inflation already straining household budgets, new tariffs could stack on another layer of costs that families can’t ignore when signing onto a long-term financial commitment like car ownership. Beyond the monthly payment, you’ll also face years of variable expenses like car insurance, gas, maintenance and taxes, which can spike without warning.
By considering these costs before buying a new or used car, you’ll be better prepared for the financial ups and downs of hidden car ownership costs.
Key takeaways
- The hidden cost of car ownership totals $6,894 per year, or $575 per month, on top of lease or loan payments.
- The hidden cost of car ownership increased by 3.1 percent from 2024 to 2025, outpacing the current rate of inflation.
- Drivers in Florida pay the most in hidden car ownership costs at $8,483 per year.
- Wyoming drivers log an average of 21,575 miles per year, leading to the highest average costs for gas and maintenance and repairs of any state.
The average hidden cost of car ownership is $6,894 per year
When buying a car, many drivers zero in on the sticker price or financing terms, but those numbers only tell part of the story. Drivers also need to find room in their budget for the extra expenses that come with owning a car — maintenance, gas, taxes and insurance costs can add up quickly.
Bankrate’s study found that drivers spend an average of $575 per month on these hidden expenses — this is on top of any lease or loan payments.
Car ownership expenses vary widely between states and drivers, and depend on factors such as location, driving record, vehicle type and more. Our study analyses the four major categories that often fly under the radar: car insurance, gas, maintenance and repairs, and state-level vehicle taxes. To create a fair comparison across all 50 states, we use a sample profile: a 40-year-old driver with a clean record and good credit score who owns a 2023 Toyota Camry with full coverage auto insurance.
Powered by Coverage.com (NPN: 19966249)
Coverage.com, LLC is a licensed insurance producer (NPN: 19966249). Coverage.com services are only available in states where it is licensed. Coverage.com may not offer insurance coverage in all states or scenarios. All insurance products are governed by the terms in the applicable insurance policy, and all related decisions (such as approval for coverage, premiums, commissions and fees) and policy obligations are the sole responsibility of the underwriting insurer. The information on this site does not modify any insurance policy terms in any way.

Compare auto insurance rates
Powered by Coverage.com (NPN: 19966249)
Coverage.com, LLC is a licensed insurance producer (NPN: 19966249). Coverage.com services are only available in states where it is licensed. Coverage.com may not offer insurance coverage in all states or scenarios. All insurance products are governed by the terms in the applicable insurance policy, and all related decisions (such as approval for coverage, premiums, commissions and fees) and policy obligations are the sole responsibility of the underwriting insurer. The information on this site does not modify any insurance policy terms in any way.

States with the most expensive hidden car ownership costs
Florida
The Sunshine State tops the list for highest hidden costs of car ownership in 2025. Florida drivers pay an average of $8,483 per year in hidden costs — a 3.5 percent increase over last year. Florida’s high costs can largely be attributed to insurance. The state has the third-highest average insurance rates in the nation at $3,874 per year. Their gas ($1,612), maintenance and repairs ($1,474), and vehicle tax costs ($1,524) are closer to the middle of the road.
Nevada
Rising insurance rates are also a key cost factor in the state with the second-highest hidden costs: Nevada. Average full coverage insurance rates increased 18 percent in Nevada between August 2024 and 2025. Total hidden car ownership expenses increased by 5.8 percent in the same timeframe to $8,342 per year, or $695 per month.
Louisiana
Louisiana’s hidden car ownership costs remained steady this year, only increasing by 0.4 percent from 2024 and maintaining the state’s rank as third-costliest. Drivers in the Pelican State have some of the least expensive vehicle taxes at just $1,130, and fairly average costs for maintenance and repairs ($1,460) and gas ($1,711). However, they have the second-highest average insurance costs at $3,953 per year. This puts the state’s hidden car ownership costs at $8,254 per year or $688 per month.
States with the least expensive hidden car ownership costs
New Hampshire ranks as the state with the cheapest hidden car ownership costs for the second year in a row. The Granite State is one of the few without sales tax on vehicles and has some of the lowest average car insurance rates at $1,716 per year. Average hidden car ownership costs increased 4 percent year over year in New Hampshire, where drivers now spend an average of $373 per month on hidden car ownership expenses, adding up to $4,472 per year.
Washington and Alaska follow New Hampshire with affordable hidden car ownership costs at $4,744 and $5,131, respectively. Both of these states also share low state vehicle taxes, but even states with lower average costs are seeing increases in hidden vehicle ownership costs. Hidden car ownership costs increased 7.2 percent year-over-year in Washington and 6.9 percent in Alaska. While gas and maintenance costs stayed relatively consistent, both states experienced a 12 percent increase in car insurance rates from 2024 to 2025.
Insurance makes up nearly 40% of hidden car ownership costs
Auto insurance remains the costliest hidden expense, averaging $2,679 per year or $223 per month nationwide as of August 2025. That’s 39 percent of total hidden costs. Car insurance rates are based on personal factors, like driving record and vehicle type, as well as macro factors, like extreme weather, inflation and tariffs.
Auto insurance inflation is often referred to as “sticky,” since insurance rates take a while to respond to inflation in contributing sectors like vehicle prices and auto repairs. Even as July 2025 inflation numbers held steady at 2.7 percent, the Bureau of Labor Statistics reported July’s year-over-year motor vehicle insurance inflation rate at 5.3 percent.
Tariffs haven’t directly impacted insurance rates yet, but experts warn that could soon change as vehicle costs climb across the board. “It’s not only new vehicle prices that will be impacted,” says Tyler Harp, an industry economist at the Center for Automotive Research. “Tariffs will raise the costs for aftermarket parts, which will lead to higher maintenance and repair costs.
Harp adds that the ripple effects could extend well beyond new car buyers. “Higher new vehicle prices will push more people towards the used market, which already has pricing pressures from lower sales during Covid and the chip shortage — meaning prices for used cars will also feel upward pressure. To top it all off, higher vehicle prices and higher repair costs mean insurance costs will likely rise as well.”
Tariffs will lead to inflation – and we may just now be seeing it reflected in the official inflation reports. The question is, will tariffs lead to a one-off price increase or lead to sustained inflation? Likely, hopefully, they will lead to a one-off increase in prices – though this may not be all at once, with tariff costs making their way through the supply chain— Tyler Harp, Industry Economist, Center for Automotive Research
Most expensive states for car insurance
According to Bankrate’s analysis of data from Quadrant Information Services, national full coverage car insurance rates increased by 15 percent from August 2024 to August 2025 — an extra $350. But inflation is only one of many factors driving auto insurance rates.
New York, Louisiana, Florida, Nevada and Michigan rank as the five most expensive states for car insurance. These states all share a mix of dense traffic in urban areas and higher claim rates due to factors like extreme weather and vehicle theft. State-required coverage also plays a role in higher insurance rates. New York, Florida and Michigan all require drivers to carry personal injury protection (PIP). States with PIP mandates tend to have higher insurance rates because it offers more robust coverage.
| State | Avg. full coverage premium | Compared to national avg. |
| New York | $4,031 | +50% |
| Louisiana | $3,953 | +48% |
| Florida | $3,874 | +45% |
| Nevada | $3,626 | +35% |
| Michigan | $3,236 | +21% |
Least expensive states for car insurance
Drivers living in Idaho, Vermont, Maine, Hawaii and Indiana pay the lowest average rates for car insurance. Idaho, Vermont, Maine and Indiana all share low population density, less relative severe weather risk and low vehicle theft rates. While Hawaii is a densely populated state with higher extreme weather exposure, it has a low rate of uninsured drivers, a low fatal accident rate and low vehicle theft rates. All these states benefit from a competitive insurance market.
| State | Avg. full coverage premium | Compared to national avg. |
| Idaho | $1,443 | -46% |
| Vermont | $1,491 | -44% |
| Maine | $1,631 | -39% |
| Hawaii | $1,650 | -38% |
| Indiana | $1,704 | -36% |
Gas: Relief at the pump — for some
While the hidden cost of owning a car has climbed slightly faster than inflation at 3.1 percent year-over-year, the breakdown of where drivers are spending money has shifted in unexpected ways. Insurance premiums continue to rise, straining budgets in nearly every state. Even though gas is the second-highest hidden car ownership cost, national gas prices have dropped by 10.2 percent since last year to $3.14 per gallon, according to AAA. This gives drivers in some states a much-needed break at the pump.
Drivers in the U.S. spend an average of $1,650 per year on gas — $137 per month. Thanks to lower gas prices, Americans are holding on to an extra $187 per year compared to 2024, even though national average annual mileage held steady. This decrease stems from multiple factors, including increases in crude oil production and reductions in fuel demand.
According to the Federal Highway Administration, the average U.S. driver logs 13,662 miles each year. The three states with the highest average gas costs (Wyoming, Indiana and North Dakota) all have average annual mileage at least 25 percent higher than that figure. States paying the least in gas are Washington, D.C., Rhode Island and New York.
Annual mileage is generally a stronger predictor of how much drivers will spend on gas than the cost of gas per gallon. For example, as of August 2025, California drivers pay the nation’s highest gas price at $4.50 per gallon. Yet, because they average 11,413 miles a year, their hidden gas costs total $1,973 annually, the seventh-highest figure in the country.
In some states, average mileage could indicate that people are saving money by driving less. “I would also factor in that there’s been just enough economic uncertainty induced by policies from the White House, especially in April, from trade and tariffs,” says Patrick De Haan, head of petroleum analysis at GasBuddy. “That has likely had a chilling effect on consumer sentiment as well.” Other potential factors behind a drop in mileage include changes in traffic patterns, a drop in driving population, changes in population distribution or labor market fluctuations. Indiana illustrates how a drop in average annual mileage can decrease gas expenses. Hoosier drivers cut their annual mileage from 20,560 to 18,052 from 2024 to 2025, reducing annual gas expenses by an average of $719.
Consumers are still feeling the pinch of rising inflation, maybe not at the gas pump, but to take a road trip, you've got to get a hotel room, you're going out to eat, and those costs are still prohibitively high.— Patrick De Haan, Head of petroleum analysis, GasBuddy
Maintenance and repairs: Where wear and tear add up
Vehicle maintenance and repair costs are heavily influenced not just by the make and model of your car, but also by climate, road conditions, annual mileage and the local price of parts and labor.
According to Charlie Giglio, a sales and leasing consultant in New York, not enough people consider the cost of maintenance and repairs when purchasing a vehicle, but they probably should. “Between the price of oil changes, tire rotations and stuff like that, the maintenance cost between something like a Ford Bronco and a Mini Cooper is thousands of dollars a year. You want to pick the right vehicle so you’re not spending more on maintenance.”
Data from the CPI shows that motor vehicle maintenance and repair costs are still 42.8 percent higher than pre-pandemic levels. As Trump’s new tariff policy went into effect in early 2025, many auto manufacturers have been absorbing the tax hike, but that may not last much longer. Car repairs cost more when global parts prices rise and local labor gets more expensive. Drivers are expected to feel the full effect of tariffs in both vehicle price and repair costs by 2026.
The national average cost of maintenance and repairs is $1,384 per year or $115 per month. That’s up 3.6 percent from last year, which works out to an additional $48 per year.
The top three states with the highest annual cost of maintenance and repairs are Wyoming ($1,985), Mississippi ($1,748) and Missouri ($1,744). Even though all three states have an RPP well below 100, they are also the states with the highest average annual miles. This suggests that annual mileage may be a stronger factor in the hidden cost of car ownership than the cost of living differences.
For example, California has the highest RPP (112.6) and average annual miles of 11,413. Wyoming has an RPP of just 90.8, but since the state’s average annual mileage is 21,575, drivers pay an average of $683 more per year in maintenance and repair costs.
States with the highest average cost of maintenance and repairs
| State | Avg. annual miles | Avg. cost of maintenance and repairs |
| Wyoming | 21,575 | $1,985 |
| Mississippi | 19,766 | $1,748 |
| Missouri | 18,758 | $1,744 |
| Indiana | 18,052 | $1,686 |
| New Mexico | 18,283 | $1,674 |
States with the lowest average cost of maintenance and repairs
| State | Avg. annual miles | Avg. cost of maintenance and repairs |
| Washington, D.C. | 6,678 | $750 |
| Rhode Island | 9,923 | $1,019 |
| New York | 9,750 | $1,063 |
| Pennsylvania | 10,962 | $1,083 |
| Washington | 9,951 | $1,095 |
Taxes: A patchwork of state regulation
Automobile taxes are another hidden cost of car ownership that vary widely between states, cities and even vehicle type. Some states charge sales and/or use taxes for cars annually, while some states apply a one-time sales or use tax when the vehicle is purchased or registered. Some states don’t collect taxes on cars at all. To illustrate the first-year cost of vehicle taxes, our study applies each state’s auto sales tax rate to the Kelley Blue Book Fair Purchase Price of a 2023 Toyota Camry ($25,395).
Auto sales tax rates in the U.S. can be as high as 7.25 percent to as low as zero percent. Five states: Alaska, Delaware, Montana, New Hampshire and Oregon, don’t have statewide sales or use tax, but some cities may still charge a local sales tax.
California has the nation’s highest state auto tax rate of 7.25 percent, with drivers paying an average sales and use tax of $1,841 based on a 2023 Toyota Camry. The sales and use tax rate is not the same throughout California, and total sales and use tax rates are higher in some areas. Georgia, Indiana, Tennessee and Rhode Island have the same tax rate of 7 percent, with drivers paying an average tax of $1,778. Excluding states with a zero percent tax rate, drivers in Washington pay the least amount in vehicle sales tax, with a rate of 0.3 percent and an average cost of $76.
Bottom line
In today’s uncertain economy, the hidden costs of car ownership can quietly add thousands of dollars to the price of driving each year. While you can’t control the financial impact of broader economic forces, understanding how expenses like insurance, gas, taxes and repairs affect your bottom line gives you the power to plan ahead when budgeting for a vehicle.
Editor’s note: Since publication, we updated this article to clarify that tax costs are being tallied for the first year of ownership.
Why we ask for feedback Your feedback helps us improve our content and services. It takes less than a minute to complete.
Your responses are anonymous and will only be used for improving our website.