Distracted driving statistics 2022

The latest data available from the National Highway Transportation and Safety Administration (NHTSA) shows over 3,000 people were killed by distracted driving in 2020. Whether or not you are the driver engaged in the activity, distracted driving affects everyone on the road. There are distractions of all shapes and sizes, but some precautions can help teens, parents and all other drivers avoid the serious consequences of distracted driving.
- 3,142 people were killed by distracted driving in 2020. (NHTSA)
- 8.1% of all car crash fatalities were due to distracted driving in 2020. (NHTSA)
- No state bans all cell phone use, but at least 23 states have some form of handheld cell phone usage ban while driving, and 48 states (plus the District of Columbia) have a ban on texting while driving. (Driver Electronic Usage, NHTSA)
- Fortunately, the percentage of drivers holding cell phones to their ears while driving decreased from 2.9% in 2019 to 2.6% in 2020. (Driver Electronic Usage, NHTSA)
- Distracted driving among teens age 15-17 has been shown to decrease when the number of passengers in the vehicle are limited. By limiting the number of passengers, fatalities from distracted driving decreased by 21% with zero passengers and 7% when there was one passenger. (Centers for Disease Control, CDC)
- Distracted driving was responsible for an estimated 8% of fatal crashes, 14% of injury crashes and 13% of all police-reported motor vehicle traffic crashes in 2020. (Traffic Safety Facts, NHTSA)
- Distracted driving causes about 3,000 deaths per year: 3,142 deaths in 2020, 3,119 in 2019, 2,628 deaths in 2018 and 3,003 deaths in 2017. (NHTSA)
- Additionally, distracted driving caused about 324,000 injuries in 2020. (NHTSA)
- The age group with the highest percentage of fatalities from distracted driving were ages 15-20, representing 7% of the total fatalities. (NHTSA)
What is distracted driving?
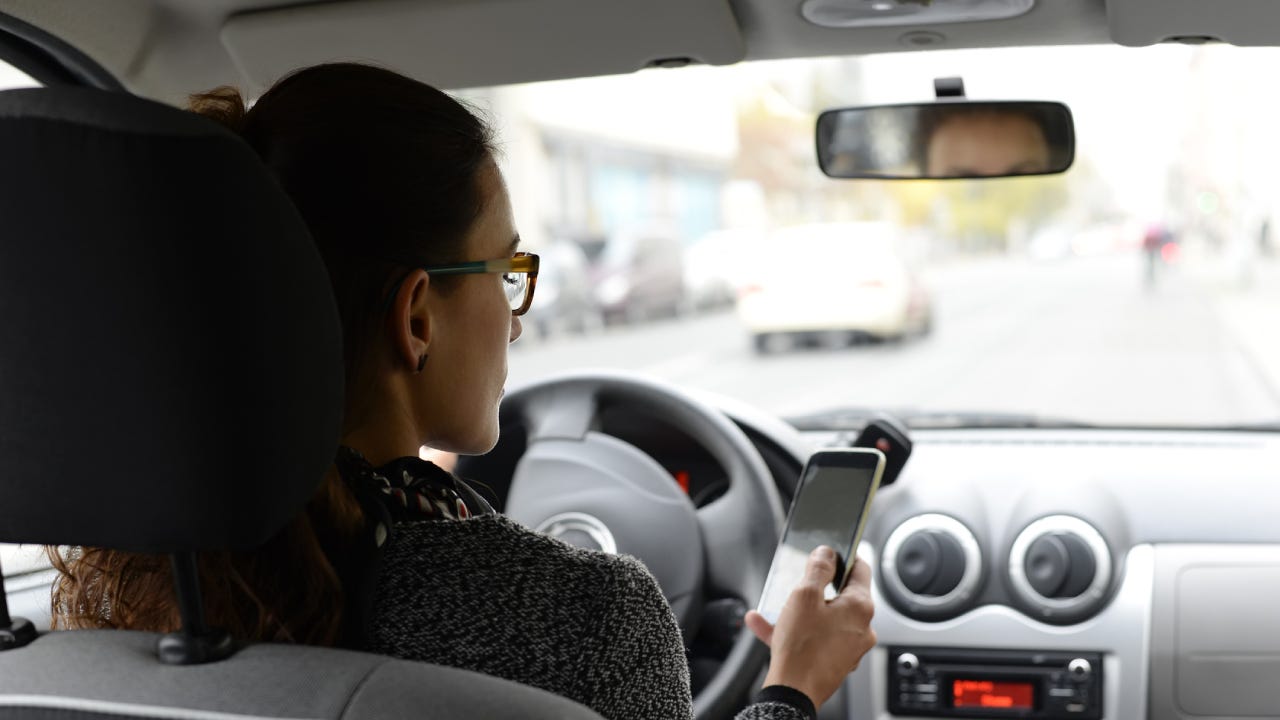
In its simplest form, distracted driving includes any kind of activity that takes your attention away from the road when you are behind the wheel. While most people associate distracted driving with cell phone use — certainly a significant contributor — distracted driving encompasses numerous behaviors like using your phone, turning around and even eating while driving in some cases.
Distracted driving types
Distractions fall into several main types of categories:
- Visual distractions cause you to move your eyes away from the road, like turning to talk to a passenger or child in the back seat.
- Auditory distractions are sounds that cause your attention to shift, like listening to music or conversations among passengers.
- Manual distractions happen when your hands move away from the wheel, like eating, drinking or using electronics.
- Cognitive distractions happen when your mind wanders and you are no longer focused on driving, like when you’re preoccupied with strong emotions or too tired to drive.
Distracted driving behaviors
Many behaviors fit into the category of “distracted driving,” so it’s important that you know the difference between a legal distraction and a personal distraction before you get behind the wheel. Here are some of the most common distraction behaviors:
- Texting while driving or having an in-depth phone conversation
- Eating and drinking
- Smoking
- Applying makeup
- Turning to grab items from the back seat
- Turning to face a passenger in the back seat
- Carrying on a conversation with a passenger
- Using electronics, like a GPS or sound system
- Focusing on the rear-view mirror
When drivers are not paying attention, they fail to comprehend or process information from objects in the roadway, even when looking at them. In other words, when you are distracted, your brain and visual processing are not working together.
Distracted driving statistics over time
While we may think of distracted driving as a newer problem as more technology is available to us in our vehicles, it has occurred for years.
In April 2006, a study released by the Virginia Tech Transportation Institute and the NHTSA found that almost 80% of crashes and 65% of near-crashes involved some form of driver inattention within three seconds of the event. The study goes on to find the most common distraction was phone use, followed by drowsiness. Interestingly, the study noted that cell phone use was far less likely to cause the crash versus other distractions. Reaching for a moving object increased the risk nine times, whereas talking on the cell phone increased the risk by only 1.3 times. This study is one of the first to look at the effects of distracted driving.
Also in 2006, the University of Utah concluded that talking on a cellphone while driving was as dangerous as drunk driving. The study was challenged because it did not show that hands-free cell phone use lessened the likelihood of a crash.
According to historical data from 2010 to 2018, the number of fatalities from distracted driving appears to have decreased. However, when you compare the number of distracted driving accidents in total to the overall number of crashes, distracted driving has remained a steady contributor, causing between 14% to 17% of all crashes.
| Year | Distracted driving deaths | Distracted driving accidents |
|---|---|---|
| 2020 | 3,142 | 680,000 |
| 2019 | 2,895 | 986,000 |
| 2018 | 2,645 | 938,000 |
| 2017 | 3,003 | 912,000 |
| 2016 | 3,197 | 905,000 |
| 2015 | 3,242 | 885,000 |
| 2014 | 2,972 | 967,000 |
| 2013 | 2,910 | 904,000 |
| 2012 | 3,098 | 908,000 |
| 2011 | 3,047 | 826,000 |
| 2010 | 2,993 | 900,000 |
Source: NHTSA Studies: 2018 and 2013
How distracted driving impacts car insurance rates
In some states, like Kansas, the police can charge you with reckless driving if you are distracted. This type of charge could make it difficult when applying for a job and certainly can affect you when shopping for the best car insurance, potentially causing your car insurance rates to increase.
On a national level, distracted driving has caused insurance premiums to increase 16% since 2011, according to The Center for Policy and Research.
Distracted driving can easily cause accidents or even cause you to put a little more pressure on the gas. And driving while intoxicated can certainly cause distractions. According to data obtained from Quadrant Information Services, here’s how several common incidents can affect your how much your car insurance costs.
| Driving record | Average annual full coverage car insurance premium |
|---|---|
| Clean driving record | $1,771 |
| DUI conviction | $3,421 |
| Accident | $2,521 |
| Speeding ticket | $2,138 |
State distracted driving laws
Unfortunately, distracted driving has many consequences, including fines, points against your license, license suspension and even jail time if you cause a crash.
Most states only have legislation that bans the use of cell phones while driving instead of broader distracted driving bans. 24 states have bans against using handheld devices while driving, 23 totally ban all cell phone use while driving, and 48 states (plus the District of Columbia) ban texting specifically. The states that don’t ban texting while behind the wheel are Missouri and Montana.
However, just because there may not be an explicit ban on eating or applying makeup while driving in your state, that doesn’t mean you can’t get in trouble for it. You can receive a secondary violation in several states if an officer sees you committing a primary violation (like running a red light) while distracted and pulls you over. Remember that police always have the power to issue a ticket for dangerous or reckless driving if your behavior constitutes it, so your safest bet is to simply not drive while distracted.
Distracted driving prevention
Fortunately, there are steps both drivers and passengers can take to lessen the occurrence of distracted driving. When we all work to prevent distracted driving, it results in safer roads for everyone. Remember these safety tips while in the vehicle:
- Put your phone away: If you need to talk or text, pull over and complete your call.
- Use a designated “texter:” If you are driving with someone, have a passenger assigned to read and send your text messages.
- Limit the number of people in your car: Limiting the number of passengers you allow in your vehicle has been shown to lessen the likelihood of distracted driving.
- Try to avoid extra activities while driving: Limit eating, drinking and smoking while driving.
- Don’t multitask: Make a promise not to multitask while driving.
- Properly secure your kids and pets: Make sure everyone is properly buckled in and restrained, this is not only for their safety, but it also prevents distraction.
- Try programming the navigation beforehand: Before you hit the road, put your destination into your GPS, so you will not be tempted to enter it while driving.
- Encourage friends and family not to text and drive: If you see someone texting and driving, speak up and encourage them to put the phone away.
- Limit phone conversations: Talk with your employer and let them know you need to limit your phone conversations and responses while driving.
- Don’t take your eyes off the road: Avoid the temptation of activities such as grooming, reading and applying makeup.
Methodology
Bankrate utilizes Quadrant Information Services to analyze 2022 rates for all ZIP codes and carriers in all 50 states and Washington, D.C. Rates are weighted based on the population density in each geographic region. Quoted rates are based on a 40-year-old male and female driver with a clean driving record, good credit and the following full coverage limits:
- $100,000 bodily injury liability per person
- $300,000 bodily injury liability per accident
- $50,000 property damage liability per accident
- $100,000 uninsured motorist bodily injury per person
- $300,000 uninsured motorist bodily injury per accident
- $500 collision deductible
- $500 comprehensive deductible
To determine minimum coverage limits, Bankrate used minimum coverage that meets each state’s requirements. Our base profile drivers own a 2020 Toyota Camry, commute five days a week and drive 12,000 miles annually.
These are sample rates and should only be used for comparative purposes.
Incident: Rates were calculated by evaluating our base profile with the following incidents applied: clean record (base), at-fault accident, single speeding ticket, single DUI conviction and lapse in coverage.
You may also like

Factors that impact your cost of car insurance

How a recession could impact your car insurance

Teen driving facts and statistics


