The best and worst states for driving

The United States has the most roadways on the planet, with more than 4 million miles of open road. Across the 50 states, you can get virtually any type of driving experience: coastal highways, desert one-lanes, mountain roads, sprawling suburbs and bustling cities. However, some states offer more favorable driving conditions than others. Our team researched the best and worst states in the country for driving, and what implications that may have on your car insurance policy.
What are the best and worst states for driving?
To determine the best and worst states for driving, our insurance editorial team evaluated four key factors: traffic, accidents, theft and extreme weather. Not only do these influence your driving experience, but they can also play a role in determining what you pay for car insurance. Heavy traffic, high accident rates, rampant vehicle theft and extreme weather all make the chances of you filing a claim higher. To make up for this added risk, car insurance rates are usually set a little higher.
Different states stood out as better or worse in different categories. Rhode Island, for instance, had some of the poorest road conditions but ranked well in terms of low traffic congestion. California, on the other hand, scored poorly across multiple categories.
Of course, you can’t neglect personal preference when considering the best and worst states for driving. One person’s dream commute on a windy mountain highway is another person’s nightmare. Ultimately, the best — and worst — states for driving will change from person to person.
Traffic
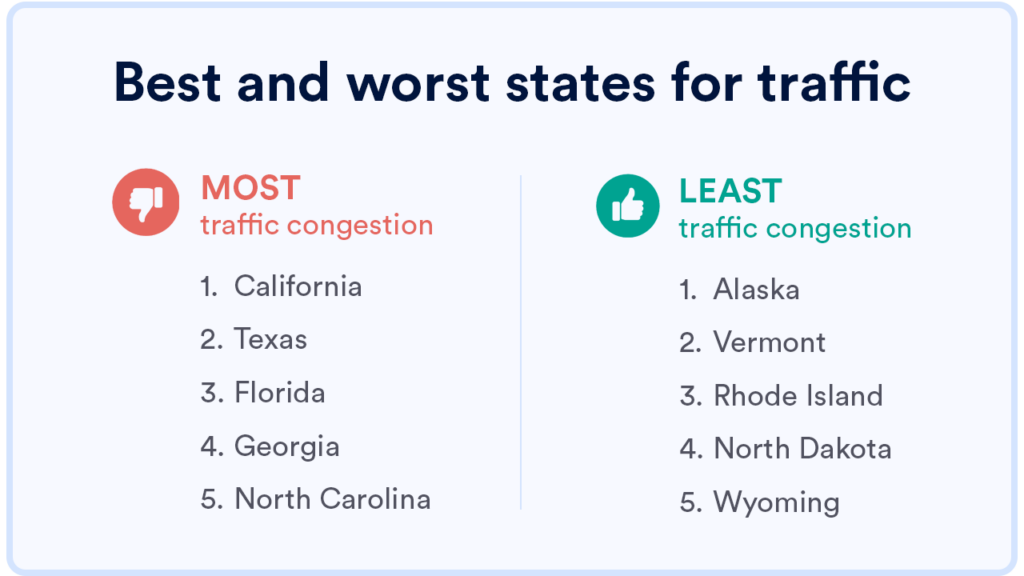
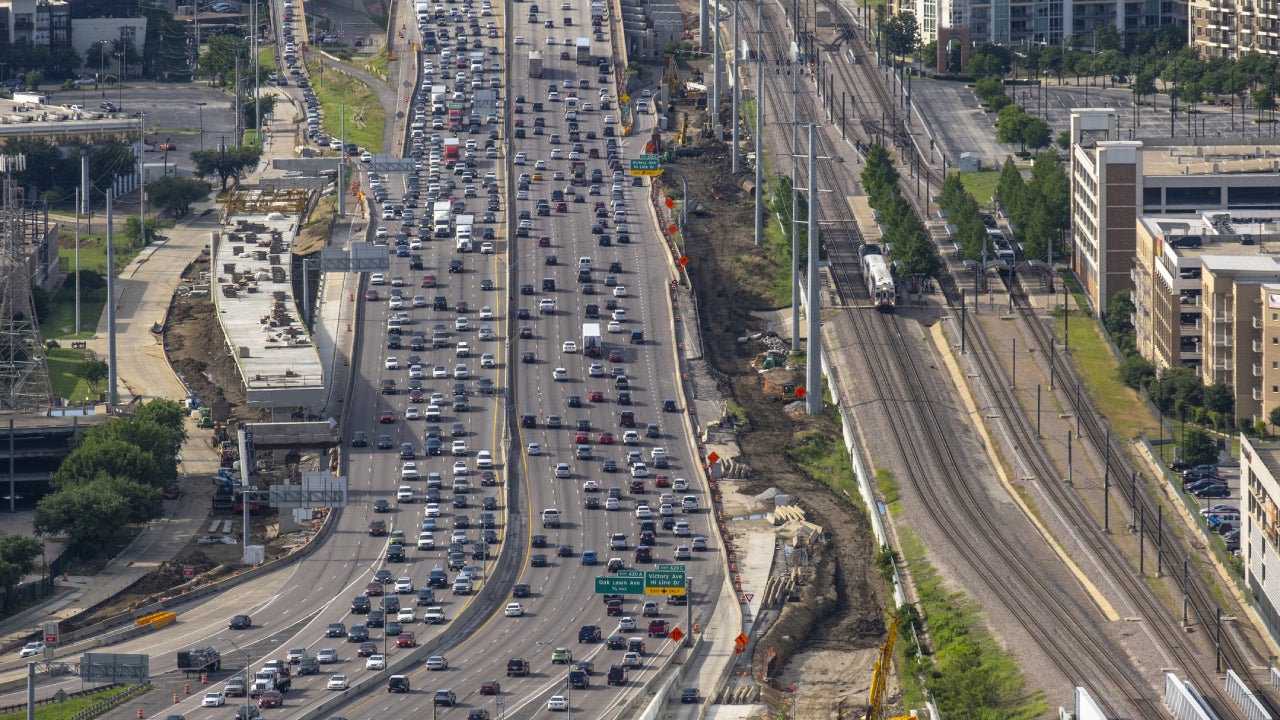
In 2024, Americans lost an average of 43 hours to traffic. However, some areas of the country fared better than others in terms of congestion. To measure traffic congestion, we looked at the Federal Highway Administration’s 2022 report on vehicle miles traveled per lane mile. This metric captures how many cars drive over a specific stretch of road over a certain period of time.
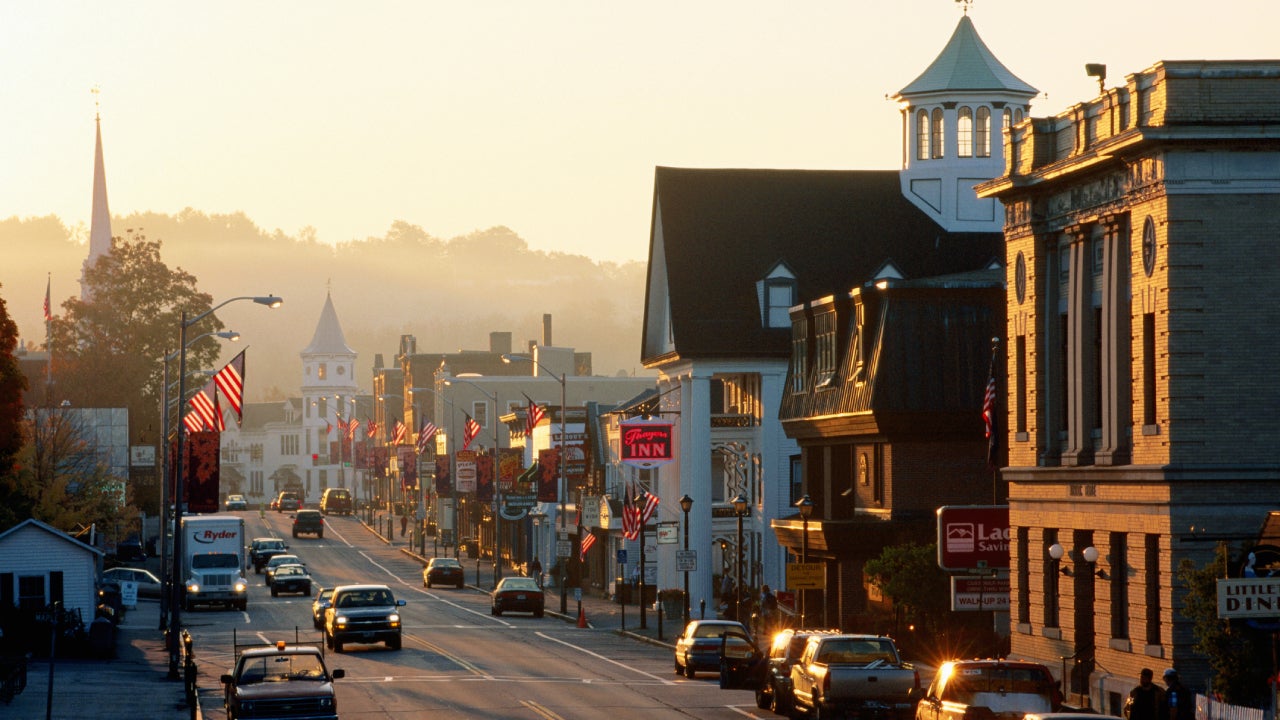
California had the most congested roadways, while Alaska had the least. Vermont had the second-least crowded roadways. Interestingly, Rhode Island had some of the fewest reported levels of traffic congestion despite it being a densely populated state.

Accidents
When the 2020 COVID-19 pandemic hit, many drivers were working from home, opting for grocery delivery over in-person shopping and, generally, staying off the roads. Restrictions eased around March 2022, which led to a sharp uptick in driving. According to the Federal Highway Traffic Administration, Americans drove an estimated 277.4 billion miles in March 2022. With the pandemic five years in the rear-view mirror, it’s safe to say that drivers are back on the roads. Fortunately, this driving resurgence hasn’t brought about a sharp uptick in accidents. The National Highway Traffic Safety Administration (NHTSA) estimated that, throughout the first nine months of 2024, around 29,000 people lost their lives to car accidents — down 4.4 percent from that same period in 2023.
Texas, California and Florida experienced the highest total numbers of traffic fatalities in 2023. However, Mississippi, South Carolina, Arizona, Kentucky and West Virginia had the highest car crash fatality rate per 100 million vehicle miles traveled. Massachusetts, Minnesota, New Jersey, Utah and Wisconsin, on the other hand, had the lowest.
States with the highest rate of car crash fatalities
| State | Car crash fatality rate per 100 million vehicle miles traveled (VMT) | Car crash fatalities in 2023 |
|---|---|---|
| Mississippi | 1.73 | 715 |
| South Carolina | 1.70 | 1,028 |
| Arizona | 1.69 | 1,315 |
| Kentucky | 1.65 | 828 |
| West Virginia | 1.64 | 267 |
States with the lowest rate of car crash fatalities
| State | Car crash fatality rate per 100 million vehicle miles traveled (VMT) | Car crash fatalities in 2023 |
|---|---|---|
| Massachusetts | .56 | 348 |
| Minnesota | .71 | 418 |
| New Jersey | .78 | 615 |
| Utah | .80 | 280 |
| Wisconsin | .87 | 584 |
Theft
California was the top state for vehicle theft in 2024, outranking the other states by a long shot. There were a reported 181,571 incidents of vehicle theft in the Golden State last year, according to a report obtained by Bankrate from the National Insurance Crime Bureau. To put this figure into perspective, California had almost 100,000 more reports of vehicle theft than Texas, the second-ranked state. Wyoming came last, with fewer than 1,000 vehicle thefts in 2024.
California is a large state, so in some ways it makes sense that it clocks a lot of thefts, but even when looking at thefts per capita, California still comes in top of the list among the states. Only Washington, D.C., outpaces California in car thefts per 100,000 people.
States with the most vehicle theft
| State/District | Number of vehicle thefts per 100K people in 2024 |
|---|---|
| Washington, D.C. | 842.40 |
| California | 463.21 |
| New Mexico | 458.24 |
| Colorado | 430.04 |
| Nevada | 394.42 |
States with the least vehicle theft
| State/District | Number of vehicle thefts per 100K people in 2024 |
|---|---|
| New Hampshire | 48.35 |
| Idaho | 68.18 |
| Maine | 78.59 |
| Wyoming | 95.54 |
| West Virginia | 101.89 |
You’re only covered for vehicle theft if you carry what’s called comprehensive coverage; without it, you’d need to pay to replace your vehicle out of pocket. Comprehensive coverage is optional, meaning it’s not part of any state’s minimum coverage requirements. It could, however, be a requirement from your financial lender if you used a loan to purchase your vehicle. In areas with higher concentrations of vehicle theft, insurers usually charge more for this coverage type.
Extreme weather
Extreme weather is a hot topic in home insurance, but your car can be a victim of Mother Nature, too. For example, during the January 2025 Los Angeles wildfires, the California Department of Insurance reported more than $73 million in auto insurance claims, representing 5,597 claims.
Extreme weather conditions can affect your auto insurance in more ways than one. Hail, wildfires and floods can all directly damage your vehicle. In that case, you’d need to file a claim under the comprehensive coverage part of your policy. Extreme weather can also affect infrastructure, making roads more dangerous. In fact, rising temperatures are expected to add an additional $19 billion each year to pavement repair costs by 2040.
A report from ConsumerAffairs looked at climate, weather, soil conditions and road construction materials to determine the states with the best and worst road conditions. Indiana was ranked first overall, thanks to its low percentage of both urban and rural roads in poor condition. New Mexico came last, with more than 40 percent of urban roads in poor shape.
States with the best road conditions
| State | Percentage of urban roads in poor conditions | Percentage of rural roads in poor condition |
|---|---|---|
| Indiana | 5.3% | 2.5% |
| Alabama | 3.5% | 1.3% |
| Idaho | 10.1% | 4.0% |
| Minnesota | 13.7% | 6.6% |
| Kansas | 10.4% | 3.9% |
States with the worst road conditions
| State | Percentage of urban roads in poor conditions | Percentage of rural roads in poor condition |
|---|---|---|
| New Mexico | 41.7% | 30.7% |
| Mississippi | 40.9% | 27.6% |
| Hawaii | 44.3% | 28.5% |
| Louisiana | 38.2% | 21.2% |
| Rhode Island | 39.3% | 32.2% |
Bottom line
Knowing the driving risks in your state can help inform your coverage decisions. Do vehicle thefts abound in your area? Consider comprehensive coverage. Does your state have poor road conditions? Roadside assistance could be a smart addition to your policy. When in doubt, chatting with a local, licensed insurance agent can help shed some light on what coverage types you need for the roads near you.
Why we ask for feedback Your feedback helps us improve our content and services. It takes less than a minute to complete.
Your responses are anonymous and will only be used for improving our website.


