Homeowner data and statistics 2024

As Americans grapple with the steep cost of, well, everything, homeownership has gotten to be an elusive goal. It peaked in 2005 when well over two-thirds of American housing units were “owner-occupied” (as U.S. Census Bureau lingo puts it). Then it began to sink, down to 63.1 percent in 2020 — its lowest level in five decades. It has barely budged since then.
It’s not hard to see why. While inflation has finally started to cool, home prices have stayed hot. In fact, they’ve hit near-record heights. The nationwide median sale price for a home in July was $422,600, according to the National Association of Realtors (NAR). That’s the highest price on record for July, marking 13 consecutive months of year-over-year price increase. That reality is not helping homeownership rates in the United States.
The high cost of borrowing hasn’t helped either. Mortgage interest rates have nearly tripled from around 3 percent during the pandemic to 8 percent in October 2023. Rates have since retreated, but even at 6.46 percent — a 16-month low — they’re still not entirely buyer friendly. The average monthly payment on a new mortgage would take over one-third (34.4 percent) of a borrower’s income (using the national median), according to ICE Mortgage Technology.
Nor are current homeowners happy. More than half of them (52 percent) say they would need a mortgage rate lower than 6 percent to be motivated to buy a home this year, Bankrate’s Mortgage Rates Survey found. They don’t want to lose their current low-low loans.
Still, there appears to be at least some opportunity on the horizon. A July report from Redfin says homebuyers on a $3,000 monthly budget have gained $22,500 in purchasing power since rates were at their most recent peak in April. In other words, homebuyers can now afford a $447,750 home, whereas just a few short months ago that same homebuyer would have been limited to a home price of $425,500, thanks to mortgage rates that were in the neighborhood of 7.5 percent at that point.
While inflation may be declining overall, the shelter category, which includes housing costs, continues to be challenging for homebuyers. Shelter is still the most significant contributor to the Consumer Price Index’s monthly all-items increase. It rose 0.4 percent between July and August and 5.1 percent year-over-year. Shelter accounts for nearly 90 percent of the all-items index’s July increase.
Given such market realities, it’s not altogether shocking that Americans now need a six-figure salary to afford a median-priced home in nearly half of U.S. states, according to Bankrate’s Home Affordability Study — more than $110,000 to be exact. Four years ago, only six states and Washington D.C. required a salary that high to afford a median-priced home.
Amid this type of data, 20 percent of aspiring homeowners think they will never be able to save enough to purchase a home, according to Bankrate’s Down Payment Survey.
Like many other aspects of the U.S. economy, however, the housing market constantly fluctuates, based on buyer demand, mortgage interest rates, inflation and amount of available inventory, amid other dynamics. Let’s look at the key facts and statistics to better inform current and future homeowners.
Key homeowner data 2024
- The homeownership rate in the U.S. as of the second quarter of 2024 is 65.6%.
- The number of U. S. households increased by just 10.1 million from 2010 to 2020, fewer than in any other decade between 1950 and 2010.
- The homeownership rate among young adults (those under 35) has declined from 45% in 1990 to 39% as of 2022.
- The number of first-time homebuyers increased to 32% in 2023, up from 26% in 2022.
- The typical recently purchased home was 1,860 square feet, had three bedrooms and two bathrooms, and was built in 1985.
- 16% of recent homebuyers are veterans and 2% are active-duty service members.
- A majority of buyers purchased their homes for 100% of the asking price, while 25% purchased for more than the asking price.
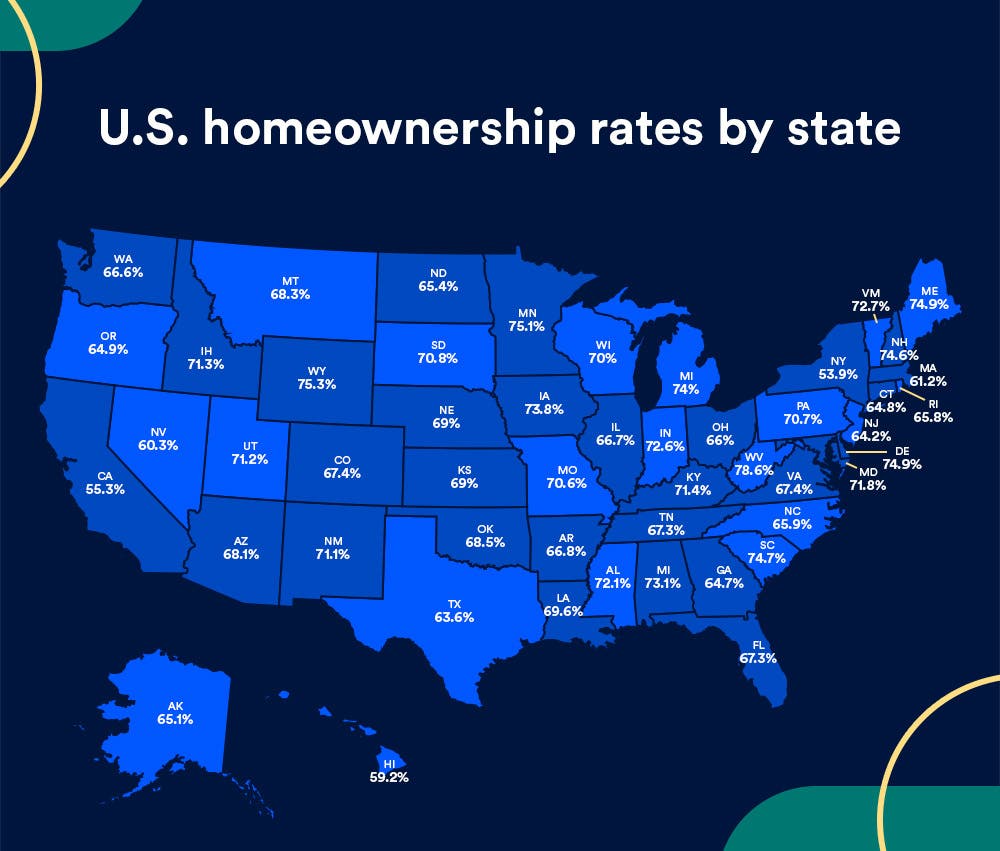
U.S. homeownership rates by state
The map below showcases homeownership rates by percentage for each state, based on the latest data from the U.S. Census Bureau.

Quarterly homeownership rates by population percentage
Typically, there is incremental movement in homeownership statistics over time. However, homeownership rates are subject to volatility during major economic events. For example, after peaking at 69 percent in 2004, the Great Recession (2007-09) led to homeownership rates declining, falling to just 63.4 percent by 2016. As homeownership began to slowly recover, the rate peaked again at 67.9 percent in the second quarter of 2020 before falling to 65.5 percent at the end of 2021, most likely due to the pandemic.
As of Q2 2024, the homeownership rate remains in the same statistical range: 65.6 percent.
The table below showcases the quarterly homeownership rate for the past four years.
| Year | First quarter rate | Second quarter rate | Third quarter rate | Fourth quarter rate |
|---|---|---|---|---|
| 2023 | 66% | 65.9% | 66% | 65.7% |
| 2022 | 65.4% | 65.8% | 66% | 65.9% |
| 2021 | 65.6% | 65.4% | 65.4% | 65.5% |
| 2020 | 65.3% | 67.9% | 67.4% | 65.8% |
| SOURCES: U.S. Census Bureau, Current Population Survey/Housing Vacancy Survey, March 15, 2023 and Quarterly Residential Vacancies and Homeownership, Second Quarter 2024 | ||||
- The homeownership rate in the U.S. was at 65.6% during the second quarter of 2024, not statistically different from the fourth quarter of 2023 (65.7%).
- National vacancy rates in the second quarter of 2024 were 6.6% for rental housing and 0.9% for homeowner housing.
- The national rental vacancy rate during the fourth quarter of 2023 (6.6%) was higher than during the fourth quarter of 2022 (5.8%).
The 10 states with the highest homeownership rates
Below are the top 10 states, ranked by the percentage of their populations who are homeowners, as of year-end 2023.
| West Virginia | 77% |
| Delaware | 75.7% |
| Mississippi | 75.5% |
| Maine | 75.5% |
| Wyoming | 74.5% |
| New Hampshire | 74.3% |
| Michigan | 74.1% |
| Minnesota | 74% |
| Alabama | 73.8% |
| Vermont | 73.7% |
The 10 states with the lowest homeownership rates
Below are the bottom 10 states, ranked by the percentage of their populations who are homeowners, as of year-end 2023.
| Georgia | 65.5% |
| Rhode Island | 64.4% |
| Alaska | 64.3% |
| Oregon | 64.1% |
| New Jersey | 62.7% |
| Massachusetts | 61.9% |
| Hawaii | 61.8% |
| Nevada | 61.2% |
| California | 55.8% |
| New York | 53.3% |
Average age of homeowners
A home purchase continues to be one of the largest investments many Americans will make in their lifetime. The graph below showcases the degree of homeownership per age group, highlighting that for many people, the homeownership journey begins before age 35 and expands over time. The group with the largest percentage of homeowners is over age 65.
Homeownership Rate by Age
-
- According to the Census Bureau, 38.6% of those under 35 are homeowners; 62.6% of those aged 35-44; 70.5% of those aged 45-54; 75.7% of those aged 55-64; 79% of those over 65.
-
- The typical first-time homebuyer was 35 years old in 2023 according to NAR, while the typical repeat-buyer was 58 years old.
-
- 14% of homebuyers purchased a multi-generational home with considerations for caring for aging parents, young adult children moving back home and cost-saving.
-
- Second quarter 2024 homeownership rates for those 45 to 54 increased to 71.1% and fell for homeowners 34 and under to 37.4% through the first quarter of 2024.
-
- 56% of millennial homeowners have some regrets about purchasing their homes, with maintenance and hidden costs being the biggest culprits, according to Bankrate’s Home Affordability Report.
The average annual cost of owning and maintaining a single-family home in the U.S. is 26 percent higher now compared to four years ago, according to Bankrate’s new Hidden Costs of Homeownership Study. The cost of owning and maintaining a home is over $18,000.
Homeowner rates by race and ethnicity
Homeownership statistics by race show that White households have the highest rates of homeownership, at 74.3 percent. The homeownership rate for Asian homeowners is the second highest at 62.3 percent, followed by American Indian or Alaskan native homeowners at 51.6 percent. For Hispanic and Black homeowners, the rates remain lower at 49.5 and 45.7 percent respectively.
Homeownership Rate by Race
- According to the Population Reference Bureau, White householders have historically had the highest rates of homeownership.
- Minority groups still face a gap in homeownership rates compared to their White counterparts, as well as a gap in the appraisal value of those homes.
- NAR reports Asian and Hispanic Americans are experiencing the highest homeownership rates in a decade.
Homeowner rates by gender
Despite often having a lower household income, women consistently make up the second largest group of homeowners, behind married couples — and have done ever since the National Association of Realtors (NAR) started keeping track in 1981.
When the NAR first began collecting data 43 years ago, 73 percent of home buyers were married couples and 11 percent were single women, while 10 percent were single men. Fast forward to 2023 and single women continue to be a force to be reckoned with: 59 percent of home buyers are married couples and 19 percent are single women, while 10 percent are single men. Single women homebuyers hit a peak in 2006, when they accounted for 22 percent of those making purchases.
While women continue to buy homes in significant numbers, they often face financial challenges or stress. The realities of the continued gender wage gap mean that women typically come to the table with a smaller down payment than their male counterparts, which requires taking out a larger mortgage. This in turn results in women starting out with less equity in their homes than men.
The rise in home equity riches
While the appreciation in home prices has made things tough for aspiring homeowners, it has also caused current homeowners to be sitting pretty.
Americans’ collective home equity hit record highs in the first quarter of 2024, clocking in at nearly $33 trillion. Many homeowners are “equity-rich,” meaning their mortgage balance is no more than half the home’s fair market value. In other words, they own more than they owe on their residences.
In short, homeownership has never been more valuable in the U.S. Not that every state has benefited equally. In Q1 2024, Vermont had the highest percentage of mortgaged homes considered “equity-rich” (82 percent) and Louisiana the lowest ($20 percent). Year-over-year, Californians saw the biggest gain in equity ($63,800), Texans the smallest ($600).
That $33 trillion in collective equity translates to an average equity stake of $305,000 per mortgage-holding household. About $244,000 of that is tappable — that is, the amount the homeowner could borrow against, leaving 20 percent equity in the home untouched (which most lenders require you to do).
And what would homeowners do with that money? Fix up the place, for sure: Bankrate’s recent Home Equity Insights Survey found that, among current homeowners, over half (55 percent) see home improvements or repairs as a good reason to tap home equity — the most popular reason by far. Paying off those credit cards is another rationale: Almost one-third (30 percent) of homeowners cited debt consolidation as a good reason to access their ownership stake for cash.
On the other hand, fully 18 percent of homeowners said there’s no good reason to tap home equity at all.


