Survey: Majority of Americans have cut their spending because of coronavirus concerns


Americans have quickly adjusted their personal finances just a few weeks into the coronavirus crisis.
The majority of Americans are cutting back their spending, according to a new Bankrate survey. They’re also holding onto their investments instead of selling, despite the swiftest drop in the history of the Dow Jones Industrial Average.
Bankrate asked 2,468 Americans whether they had cut back spending due to the economy and/or the stock market, or not. The survey also asked whether respondents took any action in response to the volatility in the stock market. Below are key findings from the survey.
Key takeaways
- 52 percent of Americans are cutting spending due to concerns about the economy or stock market.
- Higher earners were most likely to cut spending.
- 66 percent of Americans did not touch their investment accounts as volatility soared.
Most Americans are cutting spending
The Bankrate survey found that 52 percent of Americans have intentionally cut their spending due to concerns about the economy or stock market in response to the coronavirus.
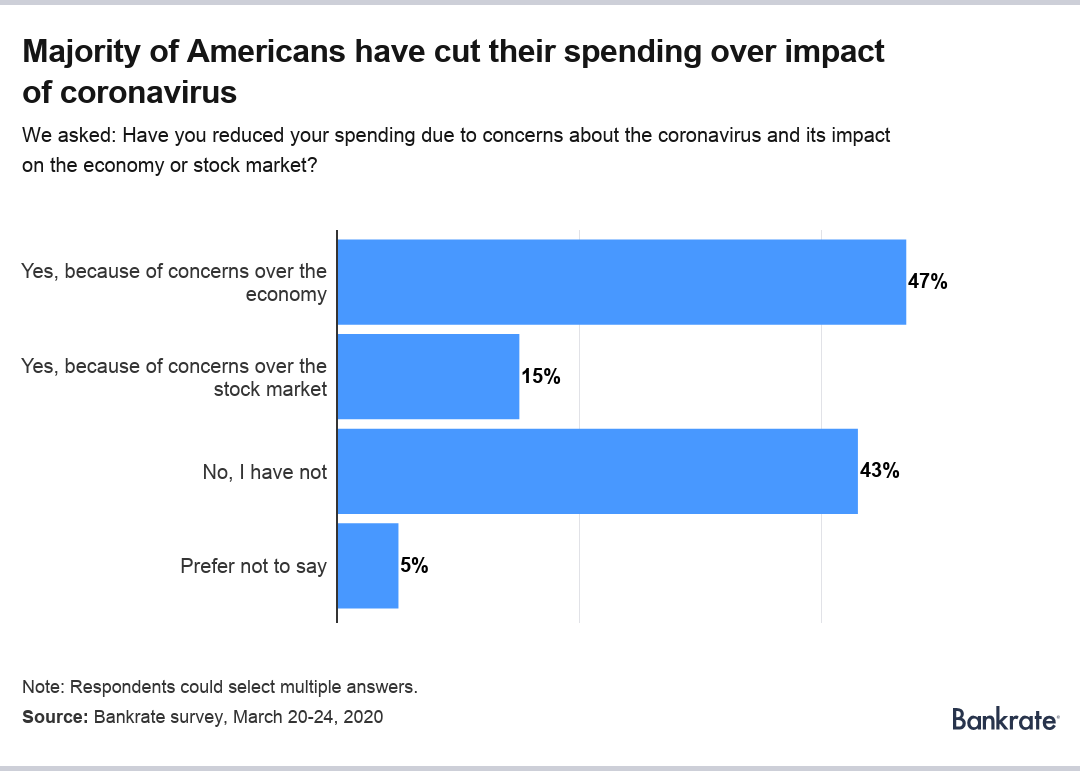
Among the respondents who said they have cut their spending:
- 47 percent said they’ve intentionally cut their spending due to concerns about the economy.
- 15 percent said they’ve intentionally cut spending due to concerns about the stock market.
Respondents were allowed to cite both reasons for their spending cut.
- 43 percent of respondents have not intentionally cut their expenditures.
- 5 percent of respondents preferred not to say whether they have cut spending.
“More than two-thirds of U.S. economic output is tied to consumer spending, and a majority of Americans are actively cutting their spending due to pervasive worries about the COVID-19 impact on the economy and stock market,” says Greg McBride, CFA, Bankrate chief financial analyst. “Take this as validation of a U.S. economic recession.”
While most Americans said they’ve cut their spending, some groups have done so with a higher frequency than others.
Higher earners are most likely to cut spending
Of the groups surveyed, higher earners and millennials were the most likely groups to cut their spending in the wake of the coronavirus pandemic.
In terms of income, a large percentage of all income groups reduced their spending, but generally the higher the income, the higher the propensity to cut back.
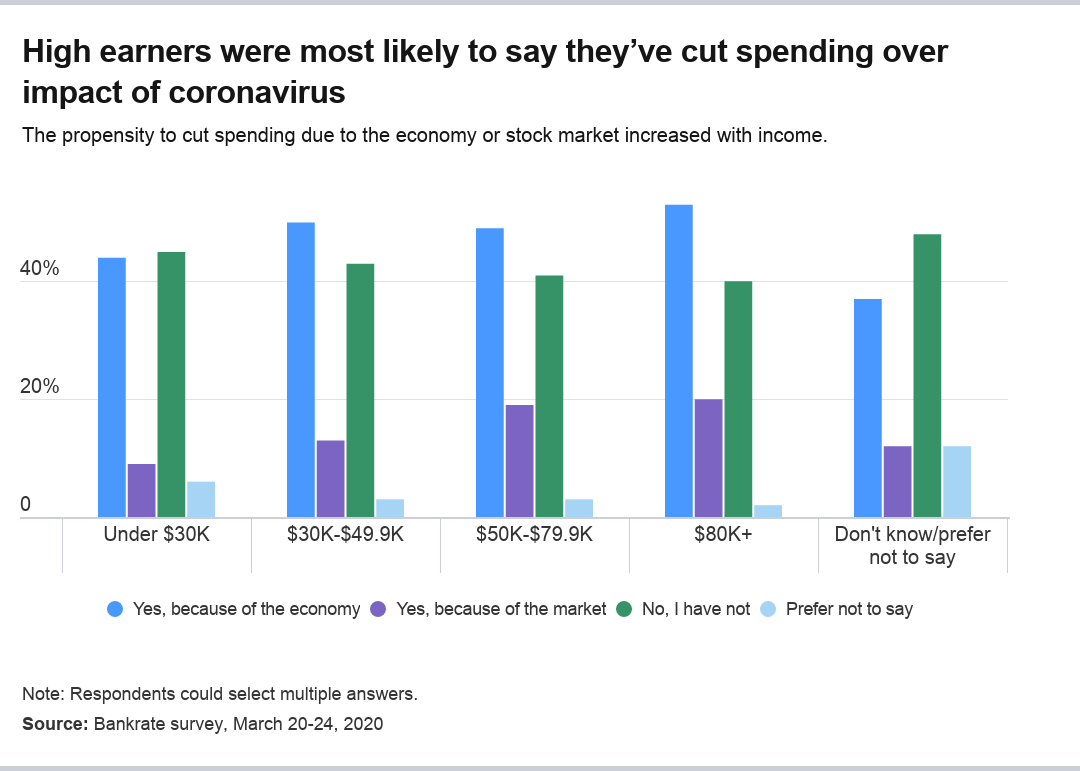
Here’s the percentage of respondents cutting their spending by income group:
- Under $30,000: 49 percent.
- $30,001-$49,999: 54 percent.
- $50,000-$79,999: 56 percent.
- $80,000 and above: 58 percent.
Among high-income households ($80K and above), 53 percent cut back due to the economy versus 44 percent of lower-income households (under $30K). Additionally, one-fifth of high-income households decreased spending due to stock market volatility (vs. 9 percent of lower-income households).
Broken out by age group, the data shows that younger groups were more likely to cut spending, with millennials the most likely group to slash their expenditures. Here are the full results by age broken out by their tendency to reduce spending:
- Millennials (ages 24-39): 56 percent.
- Generation X (ages 40-55): 56 percent.
- Baby boomers (ages 56-74): 48 percent.
At 52 percent, Generation X was the most likely to cut spending due to the economy, with millennials the second-most likely at 50 percent. Boomers at 16 percent were the most likely group to cite the stock market as a reason to cut spending.
Most Americans did not touch their investments
Bankrate’s survey respondents included 1,175 Americans who said they have retirement or investing accounts. Those participants were asked how they responded to the recent stock market volatility.
The majority of respondents – 66 percent – said they intentionally did nothing with their stock or stock-related investments such as mutual funds.
“Americans are cutting their spending, but they’re not bailing on stocks despite an unprecedented drop of more than 30 percent,” McBride says, pointing to the Dow Jones Industrial Average’s decline.
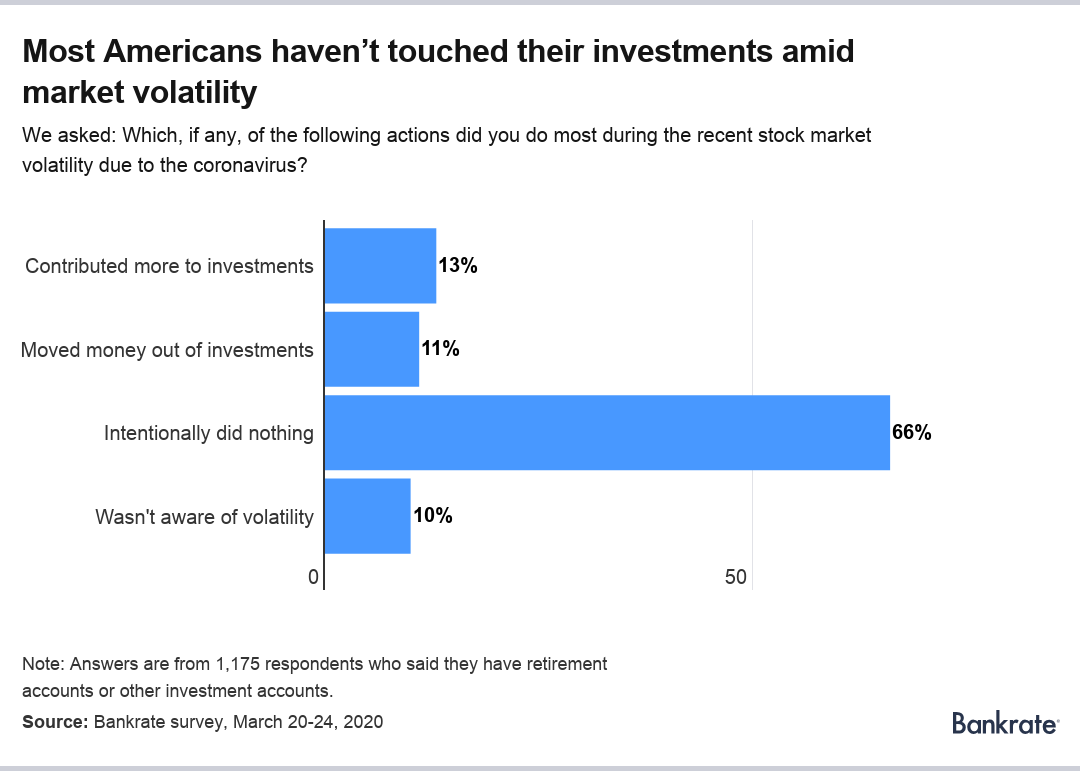
Here are the full results for how Americans with retirement or investment accounts responded to the market’s decline:
- 66 percent of respondents intentionally did nothing with their stock or stock-related investments.
- 13 percent added more to their investments.
- 11 percent moved money out of their stock-related investments.
- 10 percent indicated that they weren’t aware of the market’s move.
The results suggest that the average stock-holding American is doing what financial advisers have long preached – to hold your stocks during a decline in the market and add more, if you can.
Younger Americans were more likely than other generations to add money to stocks, and the older the group, the less likely they were to add money. Here’s the percentage of respondents who contributed more to their investments, broken down by age group:
- Millennials: 24 percent.
- Generation X: 13 percent.
- Baby boomers: 5 percent.
However, millennials were also the most likely to move money out of stock investments at 15 percent, slightly ahead of Generation X at 12 percent and baby boomers at 8 percent.
Broken out by income, the results also revealed a divergence in response to the market’s decline, with lower earners less likely to hold onto their investments. Here’s the percentage of respondents who intentionally did nothing with their investments, broken down by income.
- Under $30,000: 47 percent.
- $30,001-$49,999: 62 percent.
- $50,000-$79,999: 71 percent.
- $80,000 and above: 66 percent.
Households with income under $30,000 a year had the highest likelihood of moving money out of stocks at 20 percent.
Methodology
This study was conducted for Bankrate via online interview by YouGov. Interviews were conducted from March 20-24, 2020 among a sample of 2,468 adults. Data are weighted and are intended to be representative of all U.S. adults, and therefore are subject to statistical errors typically associated with sample-based information.
Why we ask for feedback Your feedback helps us improve our content and services. It takes less than a minute to complete.
Your responses are anonymous and will only be used for improving our website.